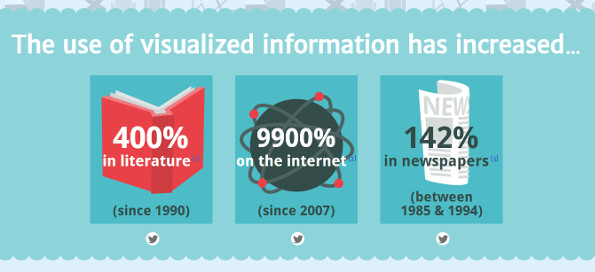
It’s 2014, and your Facebook News feed is probably polka-squared with infographics. And if you’re not sharing them with your customers, you’re leaving money on the table. Here are 13 reasons why.
Do you remember your first time? You were probably perusing Facebook on your lunch break when you saw a brilliantly-bright-colored post from one of your friends about “What You Should Watch on Netflix” or something about tigers. Drawn to the giant picture like a bug to a lamp, you clicked half-consciously.
And, all of a sudden, you were pulled into a completely magical world of startling statistics, facts, and figures. A world where information came at you in tiny segments rather than lengthy paragraphs. A world where you could learn everything you needed to know in about 45 seconds.
All of a sudden, you were pulled into a world where you actually cared about tigers.
And that, my friends, is the magic of the infographic.
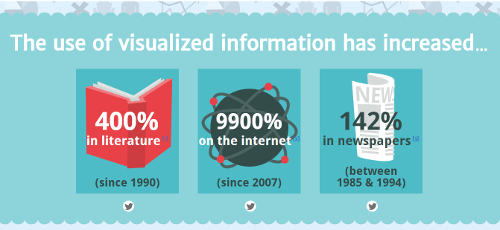
Now I’m sure you’ve been aware of this fact for quite some time—which is why you keep clicking on anything with lines, bars, and percentage signs. And if you’re a marketer, you’ve probably even had someone tell you how you need to start creating infographics since they’re so hot. But if you’re still not convinced, the folks over at NeoMam Studios produced this awesome interactive infographic to change your mind:
Seeing an awesome tool like that can be kind of discouraging to some people. Maybe you just don’t have time to build infographics. After all, you’re already stretched to the breaking point trying to manage bookings, finally finish writing the last chapter of that book, and keeping up appearances on Facebook and Twitter. I get that—so am I. So here’s the solution:
It’s time to start sharing other people’s infographics.
Why You Need to Start Sharing Infographics
Whether you created the infographic or not, your fans will appreciate the content. For years, I’ve told people that there are three ways to generate traffic for your website or your business:
(1) You can create it. You can learn everything and become the one who actually produces the content.
(2) You can borrow it. You can find the people who are creating content and piggy-back that content. Share it with your audience even though you didn’t create it.
(3) You can buy it. You can pay Google to promote your content, regardless of the quality of that content.
Bottom line: It takes a ton of time to produce a high-quality infographic. Don’t believe me? Look at the bottom of any infographic, and you’ll see the list of at least 10 sources that the author had to consult to discover the data included in the shiny finished product. Not to mention the hours it takes to design the image and figure out the best way to graphically organize the data. (Now if you do decide to make your own infographics, keep this list close at hand to avoid costly missteps.)
How long does it take to share a high-quality infographic? About 20 seconds. See, your customers don’t care if you created it or if you found it—they only care that they’ve seen it. Everyone wins: You become a trusted authority for quality content, and your customers receive quality content. And when that happens, they come back for more.
So How Do I Get Started Sharing Infographics?
My favorite tool online for finding high-quality, shareable infographics is a site called visual.ly. It’s a hub for thousands of infographics on dozens of different topics, allowing you to find only the ones that pertain to your industry. Moreover, it shows how many people have shared a given infographic, allowing you to decipher between hot topics and duds. Check it out!
And when you share an infographic on Facebook, Twitter, or Google+, keep these few tips in mind:
(1) Post a picture for the infographic– not just a link. Think of it this way: there’s a reason your friends are sharing colorful, beautiful data-pictures instead of just sharing bulleted lists of facts. Make sure you include a picture if you want your viewer to click.
(2) Use the #infographic hashtag. This is a sure-fire way to announce to the world that you’ve got something they want to see.
(3) Try to generate a conversation around the infographic. Consider telling your audience, “Comment below to share your favorite part of this sweet infographic!” or “Hey, marketing pros! What do you feel like this infographic is missing?” And be sure to keep the conversation going once it starts.
 Branding
 Strategic Marketing
 Creative Concepts
 Web Services
 Speaking & Consulting
 Website Maintenance
 Careers
 Tools We Suggest
 10 Tips to Transform Your Marketing


0 Comments