 Branding
 Strategic Marketing
 Creative Concepts
 Web Services
 Speaking & Consulting
 Website Maintenance
 Careers
 Tools We Suggest
 10 Tips to Transform Your Marketing
One of our clients thought they were steadily growing organic traffic after some changes to their site. It turns out they were recovering from a Google algorithm penalty they didn’t even know they’d been hit by. This week I share how you can use Google Analytics to prevent the same thing from happening to you.
The Myth: Penalties are Obvious
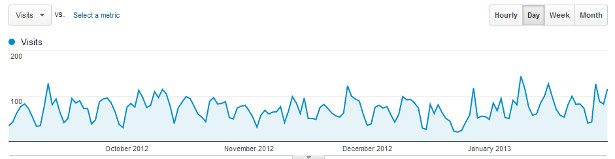
You tell yourself, if Google hasn’t physically called you to tell you to stop your spamming, then you probably weren’t fazed by Google’s algorithm changes. Google penalties look like steep drops (and sirens usually go off)– they’re unmistakable. On the other hand, when you pull up Google Analytics, you see relatively smooth dips and climbs. At least it seems to even out. Something like this:
The Reality: They Are, But You’re Not Looking for Them
You have to dig a little to see it, but Google has penalized your site. In fact, your organic traffic numbers dropped sharply in correlation with significant Google algorithm changes. How sharply? Well, one of our clients experienced month-to-month drops of 25, 20, and 18 percent! In reality, the Analytics report looked something like this: 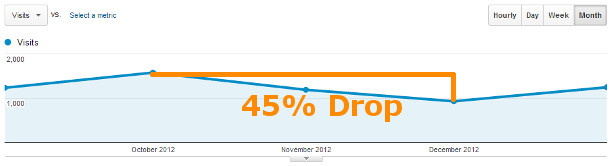 Might not look like much, but the difference between the high point in October and the low point in December is a whopping 45%. In other words, this site experienced a 45% drop in organic traffic between October and January of 2012. And if that’s not cause for sirens to go off, I don’t know what is.
On a scale of 1 (no damage) to 10 (yikes), how seriously were your sites affected by recent algorithm changes? Comment below the article to share your story.
How to Use Google Analytics to Identify a Google Penalty
1) Use segments and the Monthly view to see long-term changes.
One of the most misleading Analytics features when it comes to tracking organic traffic is the Daily view (see the first graph above. Naturally, since things seem to even out, we assume there is no change in the traffic. Scaling out to the Monthly level, however, will reduce the number of points on the graph and allow you to see big changes. Start by setting a timeframe of the last five years or so, just to get an idea for how this works (I pulled data from January 2007 to December 2013). Next, make sure you’re looking at monthly totals. Now apply an advanced segment to your data to isolate only organic traffic from Google. Here’s the configuration I’ve used: 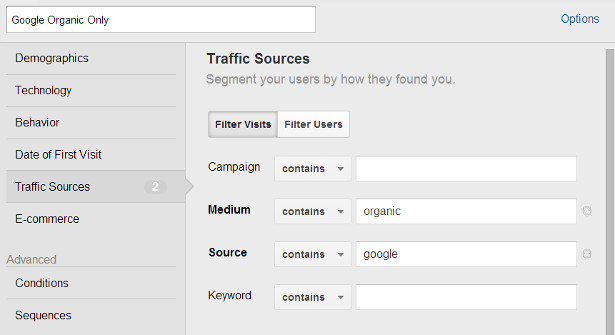 Now, with that segment applied to your data, differences from month to month start to become clearer. That means you’re a little more likely to be able to see traffic dips due to algorithm changes.
2) Create an Organic Traffic Tracker by exporting your Analytics data to CSV.
While you’re in the Monthly view, click the “Export” button near the top of the screen, and click “CSV” from the drop-down. This will allow you to download a spreadsheet of the traffic totals for each month you request. We’re going to call it our Organic Traffic Tracker (you can call it whatever you’d like upon reaching the conclusion of this tutorial. 🙂 ) 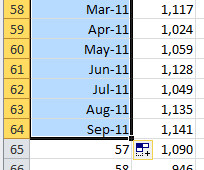 You’ll end up with a spreadsheet with two main columns: the total number of organic search visitors for a given month in one column and the “Month Index” in the other, which labels each month based on the number of months since the start of the data set. Kind of confusing, I know. Clean it up by locating Month “0” and entering the month and year that you started with (e.g., January 2007). Now pull the Fill Handle (that little black corner of the selection) all the way down to the last month. Now Excel fills in the rest of the months. Oh, and now would be a good time to save your Organic Traffic Tracker. 🙂
3) Use nifty formulas to produce the % change from month to month.
In the third column of our Organic Traffic Tracker, we’ll track the change from the previous month. And then we’ll tell Excel to mark certain boxes based on how significant the increase/decrease was. Start by adding 0 as the value for the first month, since there is no previous month in your data. Next, add this formula for the next month’s Change column:
=-(B8-B9)/B8
Now use your Auto Fill to drag the resulting value down to the bottom of your data set. You should have a long list of decimal values. Select the column and click “%” in the Number section of the Home Ribbon. Now you’ll have a long list of percentages.
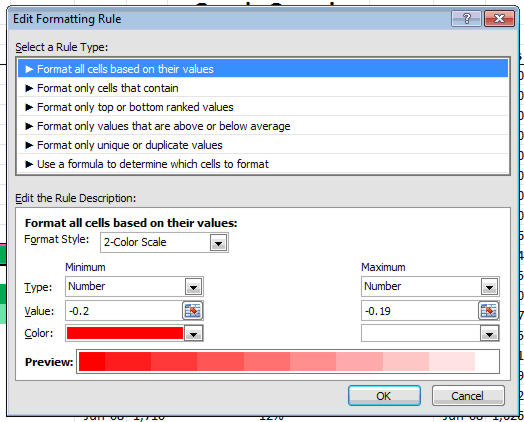
4) Use conditional formatting to make the biggest drops really stand out.
Set up a 2-color scale that will show the sharpest drops using a configuration like the one below. Note the following:
- I used red here, but blue works better if you’re going to use comments in your spreadsheet. (The comment indicator is red, too)
- Select -0.14 as the maximum so that everything -0.15 and below will be formatted.
- Using white as one of the colors ensures an easy-to-read chart.
5) Cross-check the worst months against this list. What’s the culprit?
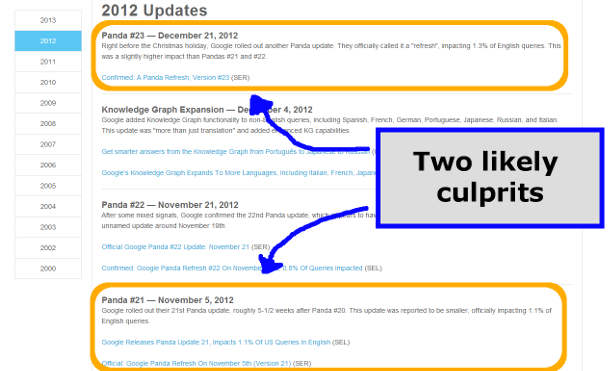
Now that you’ve identified the months where your site suffered the biggest hits, you can check to see if Google unveiled any significant updates in those months. The Moz list allows you to navigate through the updates based on the year they occurred– it will only take a few seconds to find each associated algorithm update. What I like to do at this point is add details about each algorithm update as comments on those cells in my Organic Traffic Tracker– what the update targeted, who it affected, etc. That way I can have all my info in the same place when it comes time to start trying to fix the problem.
6) Make sure your organic traffic hasn’t recovered since past penalties.
Now before you go and completely dismantle your SEO strategy in light of these discoveries, let’s do one last thing: Check and make sure the problem hasn’t already been fixed. In the case of our penalty-prone client, fortunately, an SEO-minded redesign by our team fixed the issue and caused an almost immediate recovery from the Panda penalties of late 2012. (Woohoo!)
So here’s how you check to make sure that your problem is still a problem. Turn back to your Organic Traffic Tracker. We’re going to add a second layer of conditional formatting to track gains that exceeded 20%. Its configuration will look something like this:
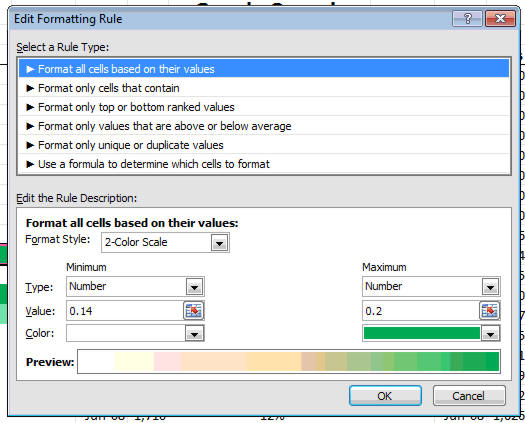
Now you’ll be able to cross-check the Moz list with your Organic Traffic Tracker, paying careful attention to the months where there were 20% increases traffic. Because those algorithm-based penalties began with Google running its algorithm, it will take another algorithm change before you see recovery from the penalty. Luckily, you probably won’t have to wait very long before Google unveils another change to its algorithm via Penguin or Panda.
So there you go! That’s one way to make sure that you know when your sites have been affected by a Google Penalty. The Google Analytics Alerts tool is also useful for catching these events as they happen.


0 Comments